← Blog
/

How to measure AI performance and ensure your AI investment pays off
High-quality human expert data. Now accessible for all on Toloka Platform.
Human and automated checks catch failures before users do.
Artificial intelligence is being deployed faster than business leaders know how to evaluate its real impact. Despite widespread enthusiasm for AI tools, many companies still lack systematic ways to check whether they deliver sustained value. In practice, this means large AI initiatives often run without clear model performance metrics, cost-benefit analysis, or alignment with business goals.
The scale of this gap is significant. IDC’s Worldwide AI and Generative AI Spending Guide (2024) projects that global spending on AI technologies, infrastructure, and related services will more than double by 2028, reaching $632 billion USD.
As more business processes rely on machine learning models and generative AI tools, the lack of clear AI performance evaluation puts organizations at risk of wasted spending, inefficient systems, and reputational or regulatory setbacks. Closing this measurement gap for AI models is now critical for AI projects to deliver verified results, not just theoretical potential.

Deloitte’s Q4 2024 GenAI survey shows that while many organizations pursue ambitious benefits from GenAI, only 40–46% report achieving key outcomes such as efficiency improvement or revenue increase. Source: Now decides next: Generating a new future
This article provides clear guidance for evaluating model quality, system quality, and business impact — while integrating responsible AI practices throughout. For organizations expanding their AI investment, knowing how to measure AI performance is now a strategic necessity.
Why AI performance measurement must be holistic
AI models' performance is inherently multidimensional. Many organizations still focus on technical metrics such as model accuracy or inference latency. While these measures are critical, they represent only part of an AI initiative's multiple metrics.
Decades of academic research and large-scale industry surveys, including McKinsey and Gartner, consistently show that narrow measurement approaches leave AI applications fragile, costly, and disconnected from business value.

For example, a multi-task benchmark for enterprise LLMs illustrates the need for holistic evaluation, spanning factual recall, reasoning, hallucination detection, and judgment tasks. Source: Enterprise Large Language Model Evaluation Benchmark, arXiv.org
A practical measurement approach must span four interdependent layers — with AI performance metrics determined for each.
Model Quality, which captures the AI model’s ability to generate accurate, robust, and generalizable results; system quality, which determines how efficiently and reliably the AI model operates in production environments; business Impact, which ties AI outputs to revenue growth, cost savings, or operational efficiency; and responsible AI, which ensures fairness, transparency, and accountability in real-world scenarios.
None of these layers can stand alone. Without this layered view, organizations risk building AI models that perform well in isolation but fail to deliver sustained business value or meet regulatory and societal expectations.
Model quality and model accuracy
At the core of any AI system is an AI model's ability to perform prediction, classification, generation, or optimization tasks, depending on the business problem. Measuring model quality goes beyond a single point estimate of accuracy. Effective evaluation must examine how well the AI model generalizes to new data, its robustness to distributional shifts, and its resilience to adversarial inputs or low-quality signals.
Why stress-testing matters
Sculley et al.’s widely cited work Hidden Technical Debt in Machine Learning Systems from 2015 established how easily well-trained models can degrade once deployed if real-world shifts are not accounted for.
Best practice means stress-testing AI models’ predictions under realistic conditions — incomplete inputs, noisy data streams, and changing distributions.
More recent research by Guan et al. shows that these risks are not theoretical: in high-stakes domains like healthcare, undetected AI performance drift can have direct consequences for safety and reliability. Their review emphasizes that robust evaluation methods must include continuous monitoring, error detection, and correction methods embedded in production workflows.
Model accuracy and squared error in practice
Common accuracy metrics — including mean squared error (MSE) — help teams see how well AI models' outputs match real-world outcomes. Without these baselines, accuracy can drift silently once deployed.
Generalization and robustness checks for regression models and absolute error
Teams should stress-test classification and regression models with AI metrics like mean absolute error (MAE) or mean squared error (MSE) to check if predictions hold up under real-world noise and drift.

A structured framework for monitoring AI model quality in production shows that effective measurement requires detection of degradation, root cause analysis, and correction. Source: Keeping Medical AI Healthy: A Review of Detection and Correction Methods for System Degradation
Continuous monitoring in production
As AI systems scale, tracking model performance across this full lifecycle is no longer optional — it’s a baseline for ensuring that AI investments continue to deliver value in changing, real-world scenarios.
System quality for AI Systems in production
Even the best-trained AI model is only as good as the system it runs on. System Quality ensures strong model performance when workloads scale. Overlooking this layer is one of the fastest ways for promising AI projects to fail under real-world conditions.
Organizations increasingly recognize this. The global MLOps market was valued at $1.7 billion in 2024 and projected to grow more than 20-fold to $39 billion by 2034, driven by the need for robust pipelines, cloud-based scalability, and integrated monitoring.
MLOps pipelines: from scripts to production
System Quality metrics typically cover inference latency, throughput, resource utilization, and availability. These have direct real-world implications. A fraud detection system must flag suspicious transactions within milliseconds. A diagnostic AI model in a hospital must guarantee uptime and a rollback path if predictions drift or degrade.
Mature teams apply containerized deployment for consistent runtime behavior, versioning and rollback to recover quickly from errors, and observability tools that flag anomalies, drift, or hidden bottlenecks. This moves pipelines from experimental scripts to robust, modular systems that are easier to test, monitor, and scale.
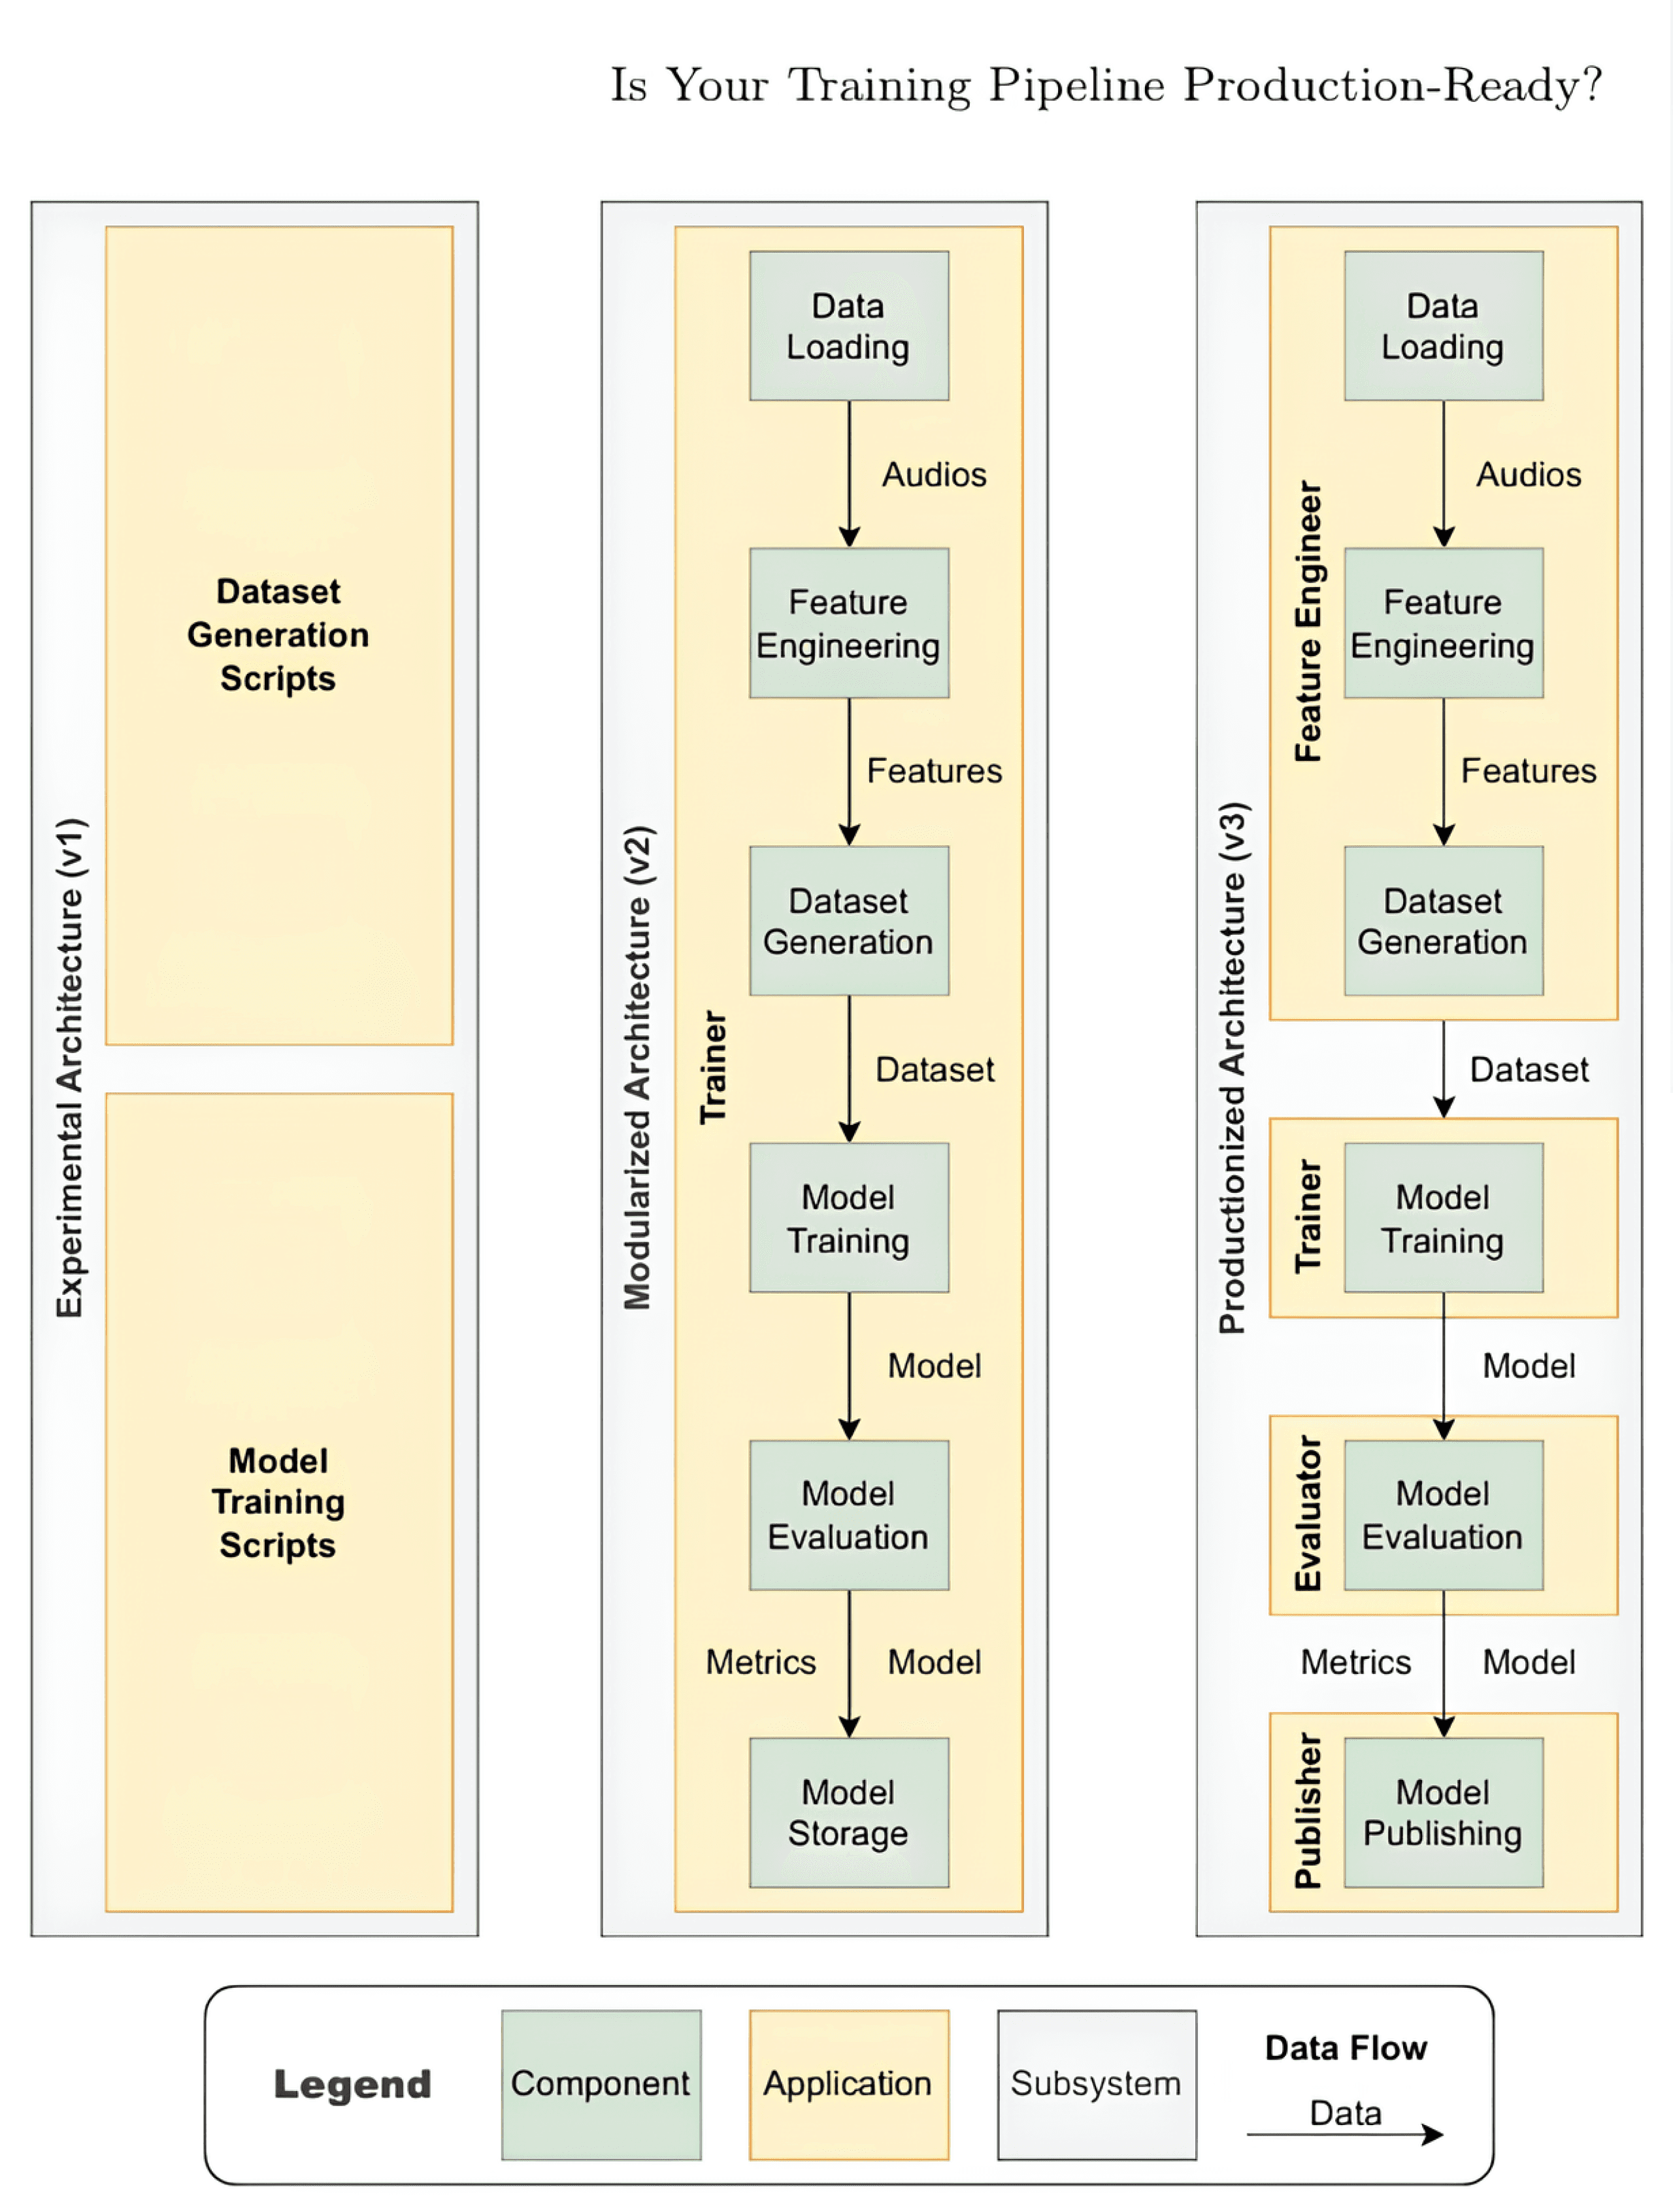
A real-world healthcare AI pipeline evolved from an early “Big Ball of Mud” to a modular monolith and then to production-grade microservices — highlighting how system design choices improve operational reliability. Source: Is Your Training Pipeline Production-Ready? A Case Study in the Healthcare Domain
Observability as a last line of defense
Well-instrumented dashboards track system-level key performance indicators alongside model metrics — latency by request type, resource loads for different inference tasks, and performance trends that can surface issues before they escalate.
As AI systems expand into mission-critical workflows, System Quality must be measured and engineered with the same discipline as the models themselves.
Business impact
AI systems that cannot be linked to measurable business outcomes often fail to justify their cost. Business Impact means tying technical performance directly to revenue growth, reduction of operational costs, cycle time improvements, or sustained customer satisfaction scores.
Large-scale surveys, including McKinsey’s State of AI, highlight that organizations beginning to see bottom-line results from generative AI do so by tracking well-defined KPIs, redesigning workflows, and putting robust governance structures in place.
Clear measurement practices are strongly correlated with reported EBIT impact. Without this connection, even technically sound AI initiatives risk remaining isolated pilots that don’t scale.
Tracking revenue with confusion matrices and fraud loss benchmarks
In practice, AI performance metrics must reflect what the business actually values. For example, major retailers now track the incremental sales revenue driven by AI-powered recommendation engines, not just clicks.
Banks and insurers benchmark fraud detection systems on actual losses prevented, analyzing true versus predicted outcomes and false positive rates to define financial limits for acceptable errors. In manufacturing, predictive maintenance teams evaluate models' performance by comparing downtime avoided and maintenance cost reductions, not just forecast accuracy alone.
Linking AI metrics to EBIT
Looking ahead, some AI initiatives are exploring frameworks that suggest benchmarking AI agents against real tasks and workflows. By mapping where AI capabilities align with actual market needs — their Technology-Market Fit — these ideas aim to move performance evaluation beyond lab metrics.

A profession-aligned evaluation framework defines domain-specific AI agents, predicts their Technology-Market Fit (TMF), and tracks how well they compete in real workflows — illustrating how performance measurement can align with true business value. Source: xbench: Tracking Agents Productivity Scaling with Profession-Aligned Real-World Evaluations, arXiv.org
Technical output is not the same as business value. If AI initiatives cannot demonstrate measurable impact — and teams can’t track it — they remain experiments, not assets. Performance measurement must be operational, not an afterthought.
Responsible AI
Responsible AI is now enforceable: global standards like the EU AI Act (2024) and NIST’s AI Risk Management Framework (2023) embed fairness, explainability, and accountability into real performance requirements. These are no longer abstract principles — they’re measurable dimensions that determine whether an AI system can be deployed and scaled responsibly.
Key metrics include:
Fairness: Monitoring for disparate impact or bias across demographic groups.
Explainability: Providing clear, accessible reasons for how AI model decisions are made.
Accountability: Maintaining audit trails, documenting human overrides, and ensuring decision traceability over time.
In regulated domains, these are already operational. For example, under the EU AI Act, credit scoring, recruitment, and biometric identification are classified as high risk. Such systems must undergo continuous bias testing, impact assessments, and clear documentation of how decisions can be contested or corrected.
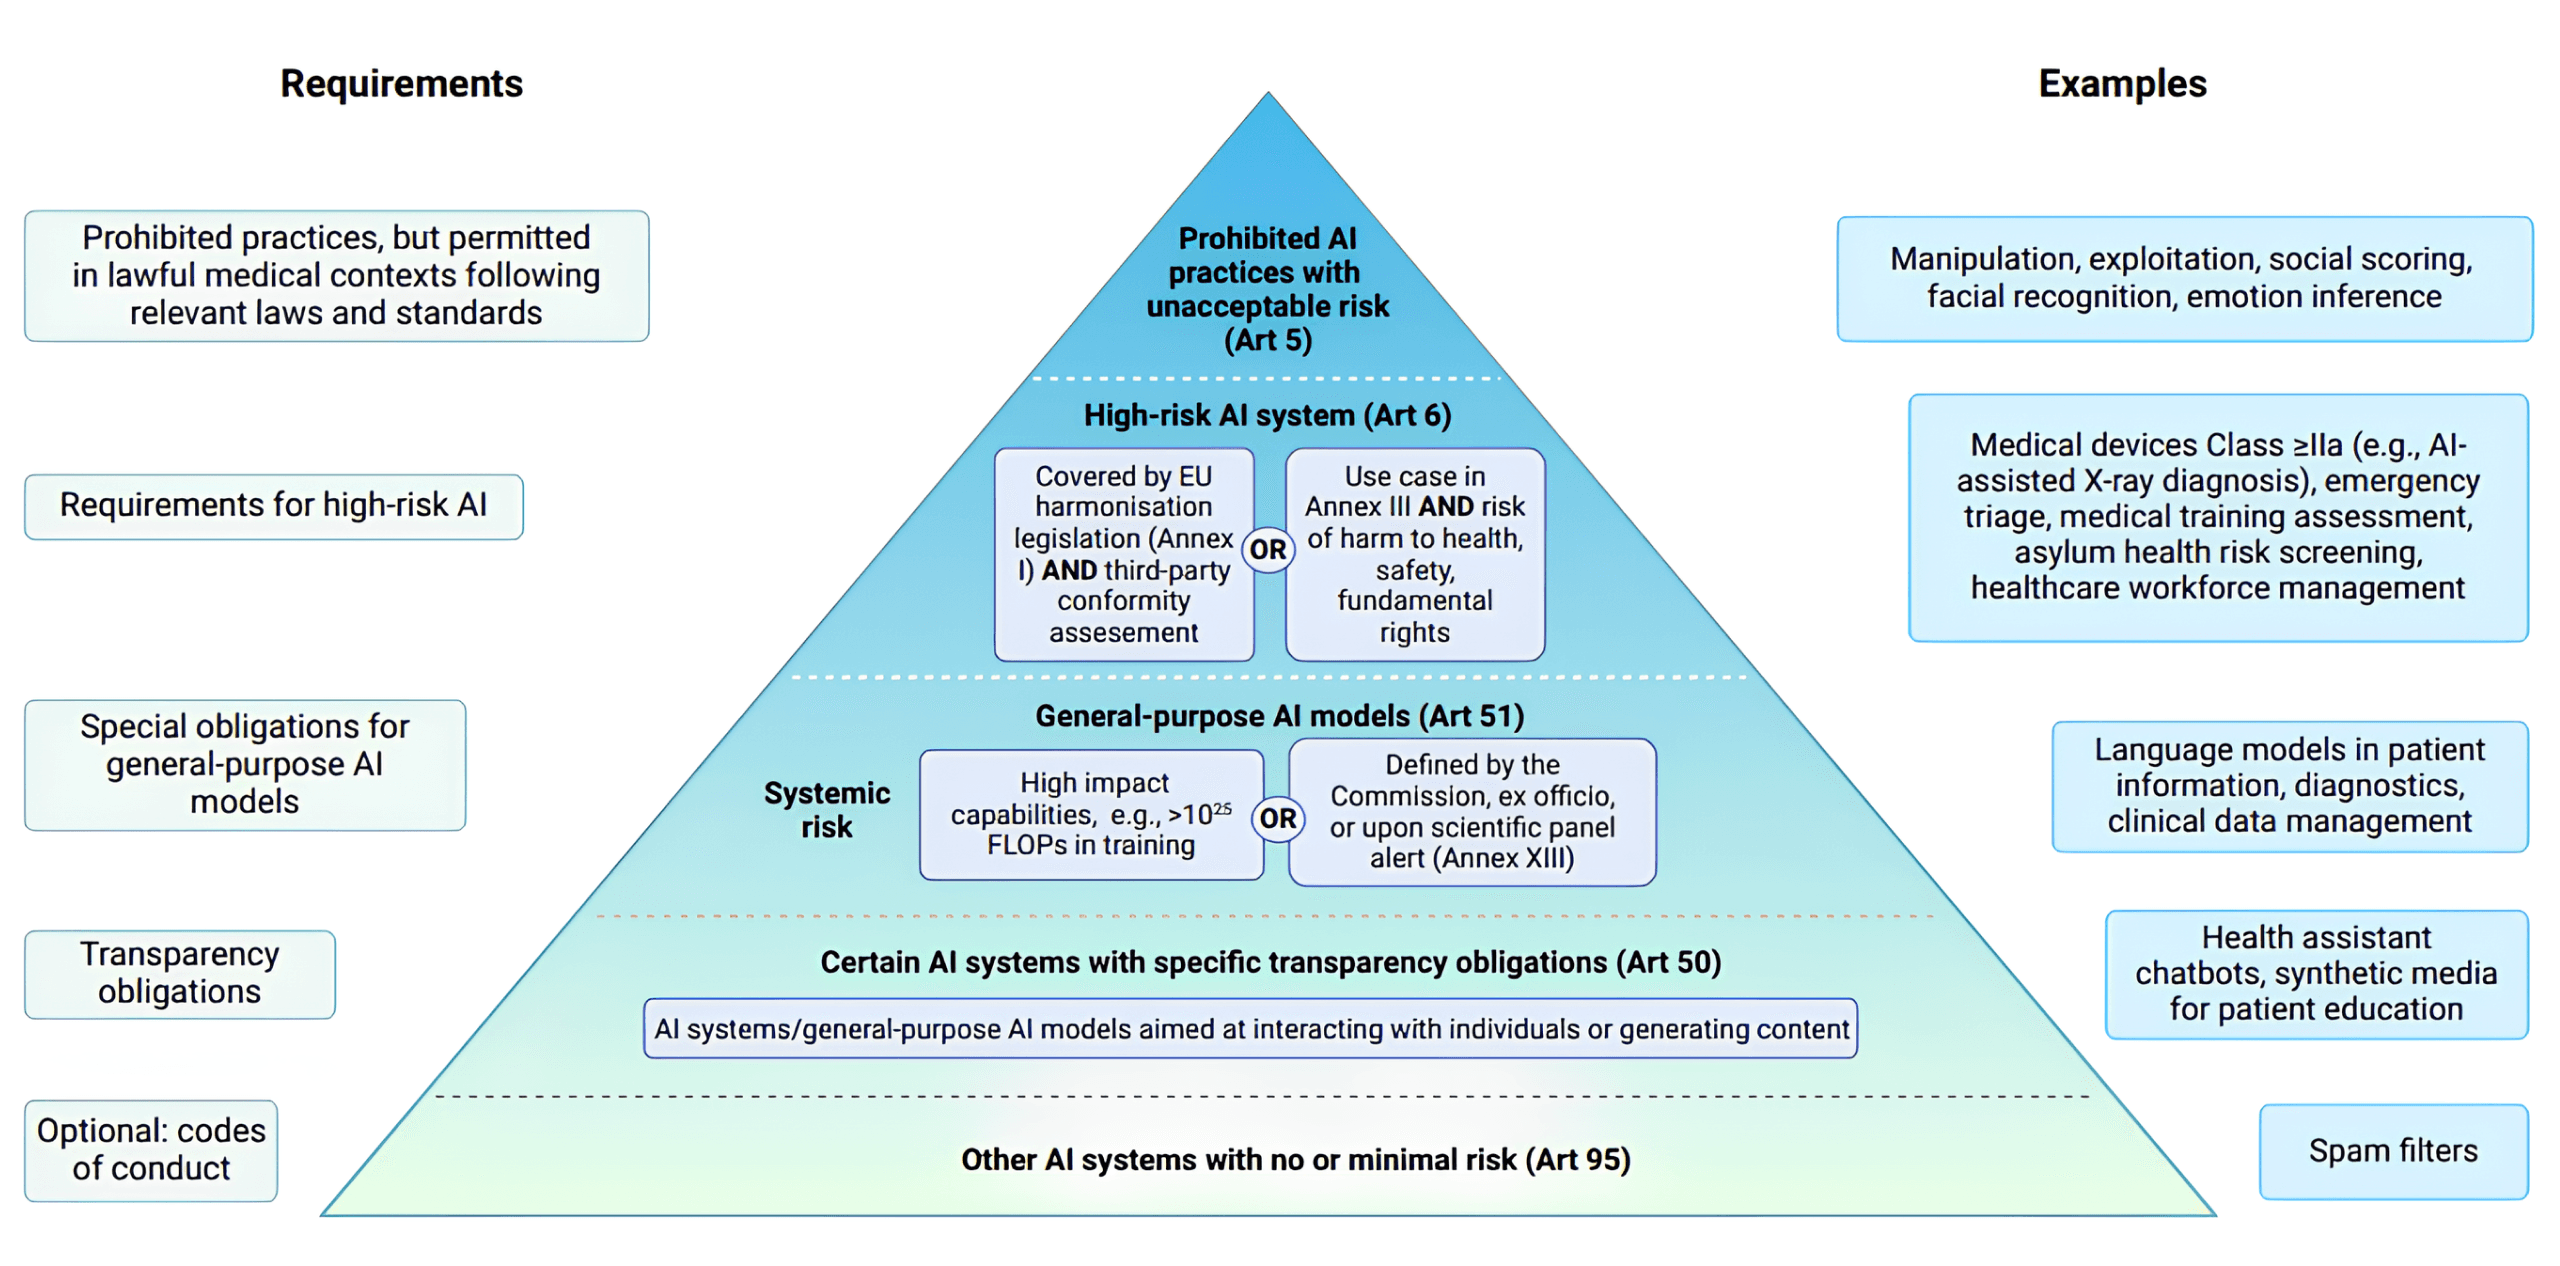
A schematic pyramid illustrating the EU AI Act’s risk-based approach — showing how AI systems are categorized from unacceptable to minimal risk. Source: Navigating the European Union Artificial Intelligence Act for Healthcare
Algorithmic Impact Assessments (AIAs) are similarly becoming mandatory in Canada and for certain US states, especially where hiring algorithms or consumer credit models are deployed.
Embedding responsible AI in dashboards
Many teams now treat Responsible AI as an integral dimension of model monitoring, rather than an afterthought. System logs must capture when and why human overrides happen, what explanations are provided, and how fairness metrics shift as input data evolves. Without these checks, even the best-performing models can expose organizations to legal, reputational, and financial risks.
Responsibility must be measurable — or it is not real at all.’
Business-centric KPIs
Measuring AI’s real-world success starts with one uncomfortable truth: if the financial impact isn’t visible on your P&L, your AI application is probably just an experiment. While many teams get lost in model scores, the smart ones design KPIs that tie every prediction or generation back to profit, customer value, or efficiency.
Financial performance
The strongest signal that AI is working isn’t buried in a model’s F1 score — financial metrics evaluate whether implementing AI was worthwhile for a given organization. But the numbers that matter look different for every industry.
For a retailer, it could be average order value, conversion lift, or repeat purchase rate. In subscription businesses, it’s customer lifetime value or churn reduction. In banking, the clearest line might be fraud losses prevented or net interest margin protected. Airlines watch yield per passenger; hotels track revenue per available room (RevPAR). Manufacturing teams measure units produced per hour or downtime avoided through predictive maintenance.
In hospitality, concrete proof is emerging fast. AI-driven dynamic pricing tools like PriceLabs’ "Hyper Local Pulse" report an average 26% lift in RevPAR within three months of deployment, thanks to granular, real-time pricing adjustments that reflect local demand and competitor landscapes. These models also integrate hyper-local data to deliver insights that reposition pricing strategy almost immediately
Good practice means setting targets that are rooted in baseline data and tested assumptions — not pulled from a slide. For example, if historical campaigns show that recommendations typically raise average order value by 1–2% during peak seasons, then an AI system aiming for a modest uplift within that range is credible. The same applies to dynamic pricing: if yield management historically moves the needle by a few percentage points, then a well-calibrated AI can aim to beat that, not promise miracles.
Customer-focused metrics
It’s easy to measure what AI makes visible — clicks, sessions, queries handled — but far harder to track whether it actually builds customer satisfaction, trust and loyalty. For any customer-facing system, the only credible signals are repeat use, retention, and positive human feedback — not proxy engagement alone.
The right evaluation metrics depend on the domain. A streaming platform should baseline churn rates before rolling out AI-powered recommendations. If personalization works, fewer subscribers cancel — proving AI automation sustains loyalty, not just views.
In banking, a faster AI chatbot looks efficient until Net Promoter Score (NPS) or complaint rates reveal whether it’s actually improving the customer satisfaction. Fraud detection systems should monitor not only alert accuracy but how often legitimate transactions are blocked unnecessarily — each friction point erodes trust.
Comparing AI-driven regions or cohorts to historical baselines makes this actionable. Vodafone, for example, refocused its AI efforts to transform internal operations and customer service after finding that poor service is a major churn driver. “It costs a lot of money and creates churn [when] customers are not happy,” said Ignacio Garcia, Vodafone Group’s AI Director. “If we do customer service well, our customers will stay with us and it will cost less” (Source: TelcoTitans).
Customer KPIs can’t be static. Behavior changes, market conditions shift, and models drift. Early wins fade if satisfaction isn’t re-baselined and monitored continuously. Without this, even well-meaning automation can quietly undermine loyalty and inflate acquisition costs.
Measuring retention and user engagement
Retention is only half the story — teams must also track repeat use and real user engagement to see if AI is building trust or just driving clicks.
Baseline comparisons make this actionable. If a telecom’s average churn is 2% monthly, and regions using AI-based outage prediction see churn drop to 1.7%, that’s a signal the AI model is adding value.
Operational efficiency
Some of the clearest AI returns come from cost savings that show up as less waste, faster cycle times, or lower error rates — but only if these gains are measured and tracked against reliable baselines.
In logistics, UPS’s ORION system has been widely cited as an example of AI-driven route optimization. UPS reports that ORION helps avoid up to 100 million unnecessary miles each year, delivering estimated annual savings of $300 million and cutting CO₂ emissions by about 100,000 metric tons.
Predictive maintenance is another area with proven impact across industries. A recent industrial survey highlights how AI-based PdM reduces unexpected downtime in sectors like automotive, wind energy, and high-performance computing by forecasting Remaining Useful Life and probability of failure in real time. These savings show up directly in lower unit production costs and better asset utilization.
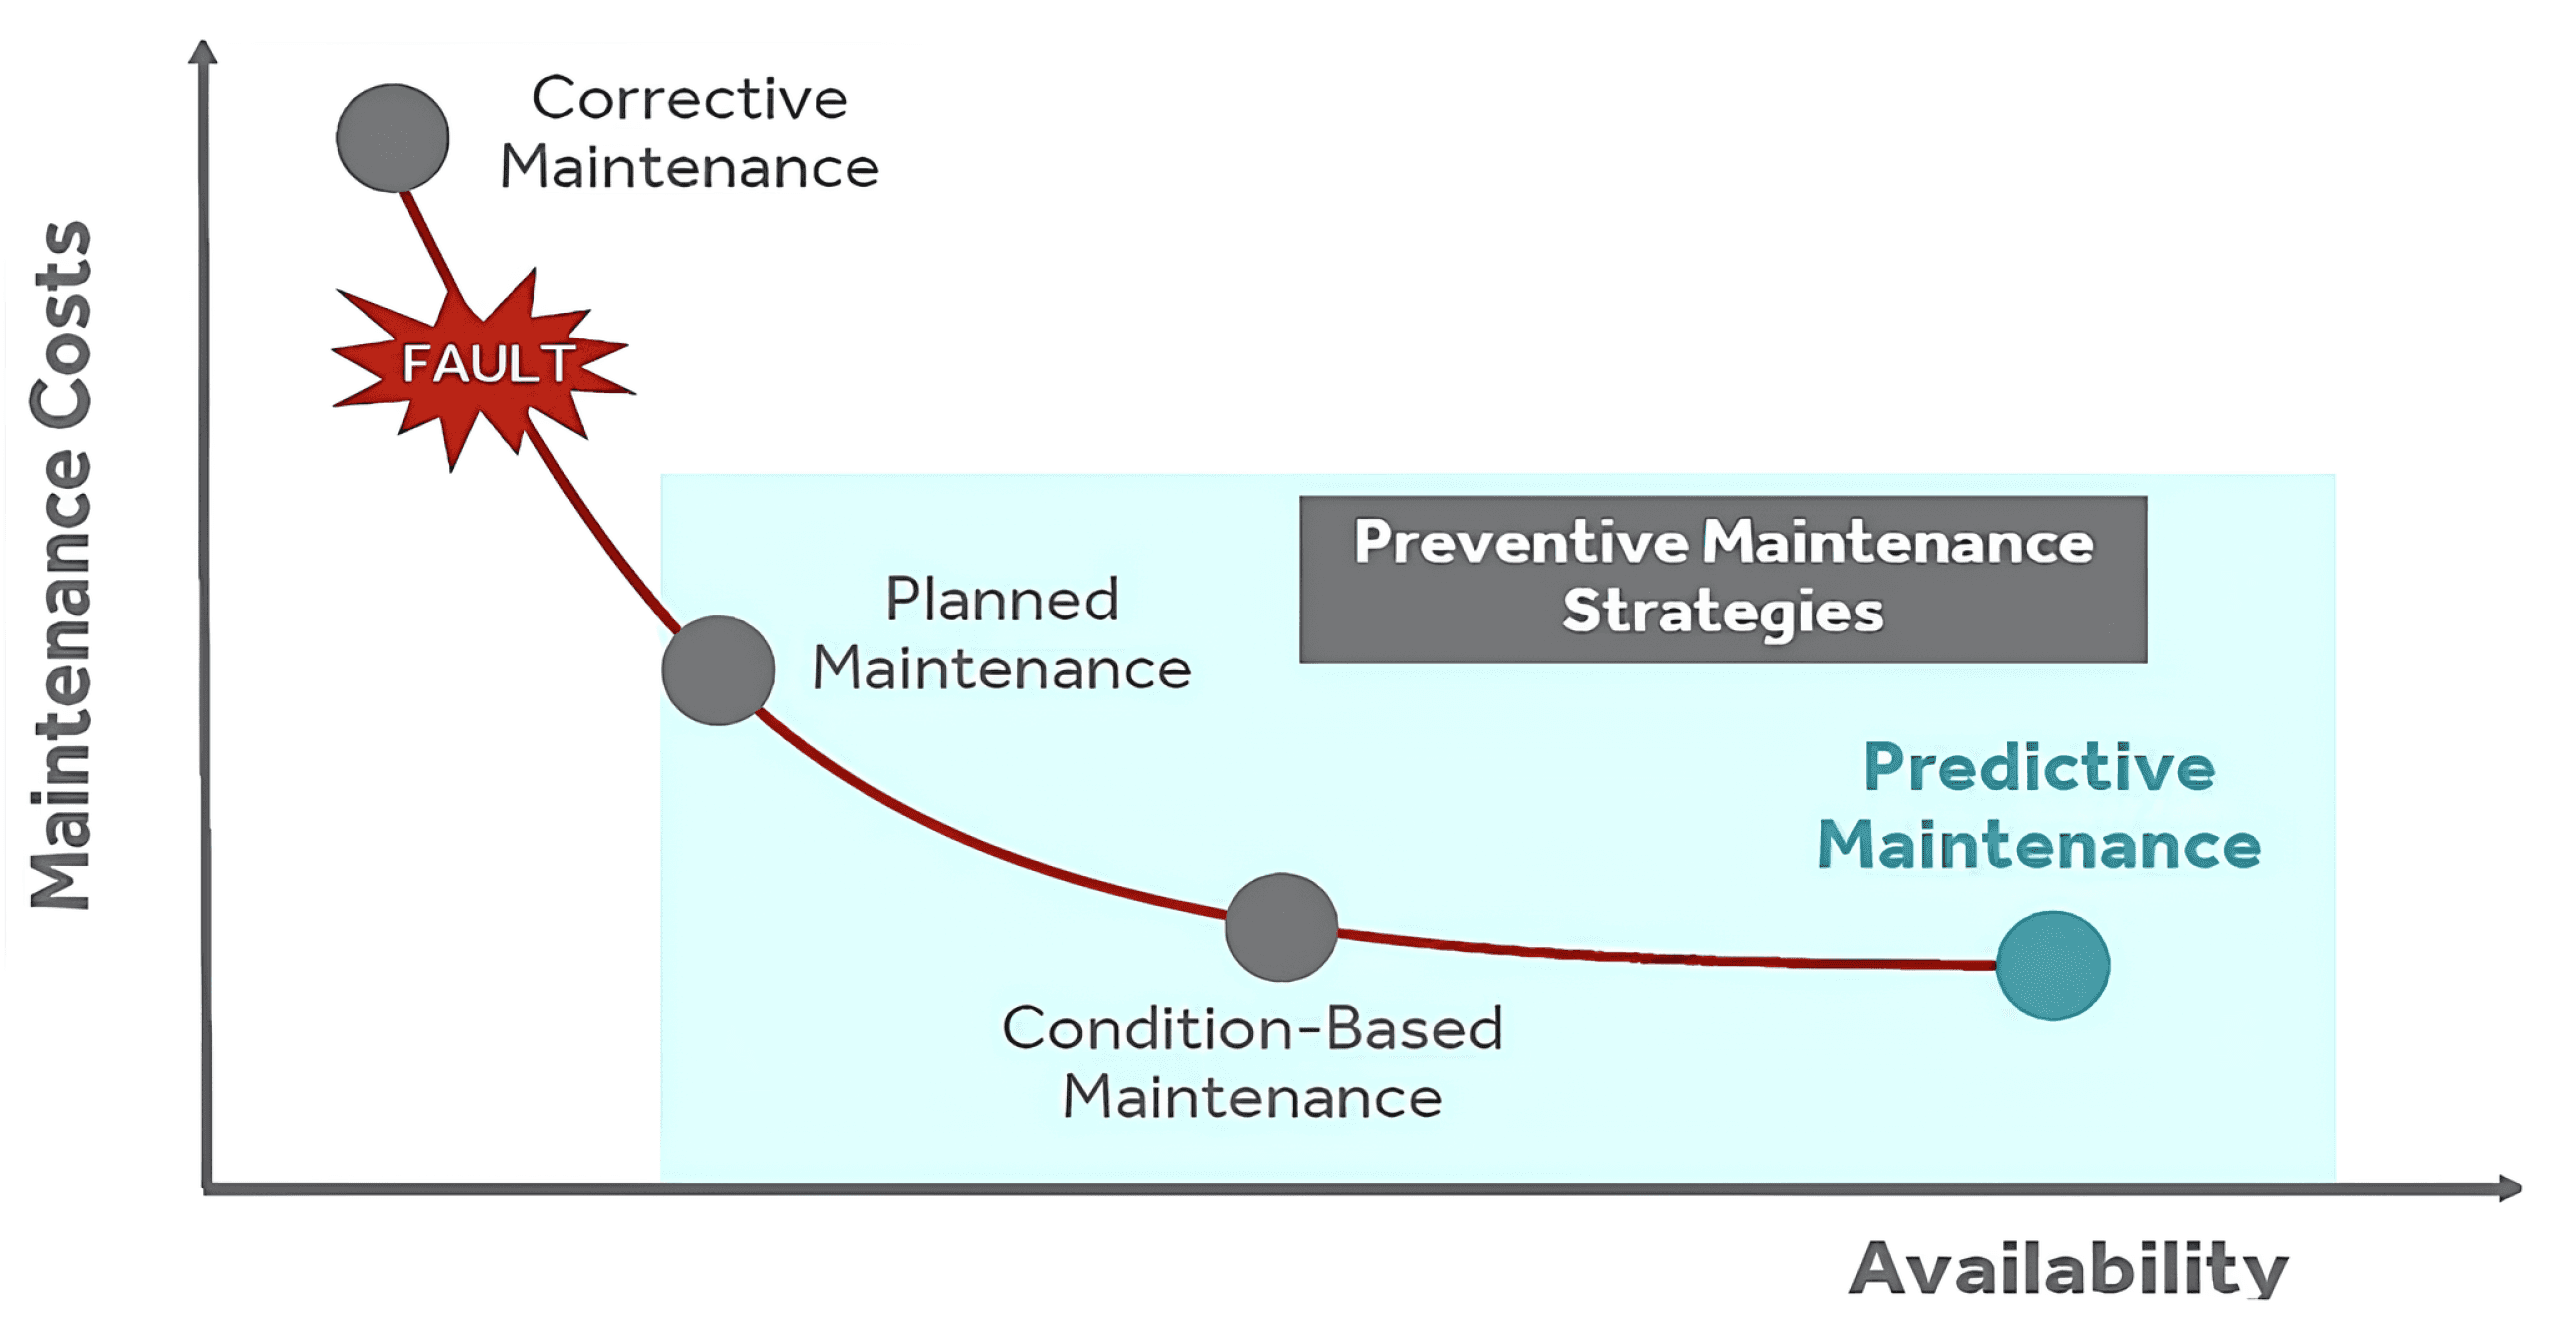
Strategy comparison showing how total maintenance costs decline and equipment availability improves when moving from corrective to predictive approaches. Source: A Survey of Predictive Maintenance Methods: An Analysis of Prognostics via Classification and Regression
In healthcare, the lesson is clear: without robust post-deployment monitoring, any efficiency gains can quietly erode. A 2025 review found that only 9% of FDA-approved AI healthcare tools included formal surveillance plans for performance drift — despite clear evidence that undetected data shifts can push error rates back up and waste time rather than save it.
Operational KPIs like miles avoided, downtime reduced, or cycle time improvements connect directly to cost-to-serve or unit economics that finance teams already trust. Without that tie-back, AI cost-saving claims stay buried in technical dashboards. With it, efficiency-driven AI becomes part of standard operating reviews, not just another pilot no one checks again.
Technical KPIs
Technical performance is the space where most AI teams feel confident — but it’s also where model performance metrics too often stop short of telling the whole story. Accuracy, precision, recall, or latency can look impressive in a test environment, but these numbers only matter if they hold up under the messy, shifting realities of production. Solid technical key performance indicators go further: they catch drift, flag brittle edge cases, and protect downstream business outcomes before failures scale.
For predictive artificial intelligence
Predictive models — whether they’re flagging early-stage patient risks, rating loan defaults, or predicting supply chain delays — rarely succeed on a single headline metric.
Robust practice combines multiple views:
ROC-AUC and lift charts help teams see how well the model separates classes at different thresholds.
Precision-recall curves show where false positives or false negatives start to carry real costs.
Calibration checks whether predicted probabilities match observed outcomes in live data.
Drift detection catches the early signs that a once-accurate model is sliding, giving fewer correct predictions, as conditions change.
Recent evidence shows this in action. In credit risk, for example, studies show that LightGBM-based models can deliver classification accuracy above 90% when supported by reliable calibration and drift monitoring pipelines. Without these checks, even a well-tuned score can break down fast if borrower behavior shifts.
In more sensitive applications, the same pattern holds. A 2025 study of AI-driven motivational interviewing used classification models to predict whether an AI-generated reflection aligns with professional therapist behaviors. Precision, recall, and ROC-AUC were tracked to confirm how reliably the system identified compliance — and SHAP scores showed which conversational features drove these predictions.
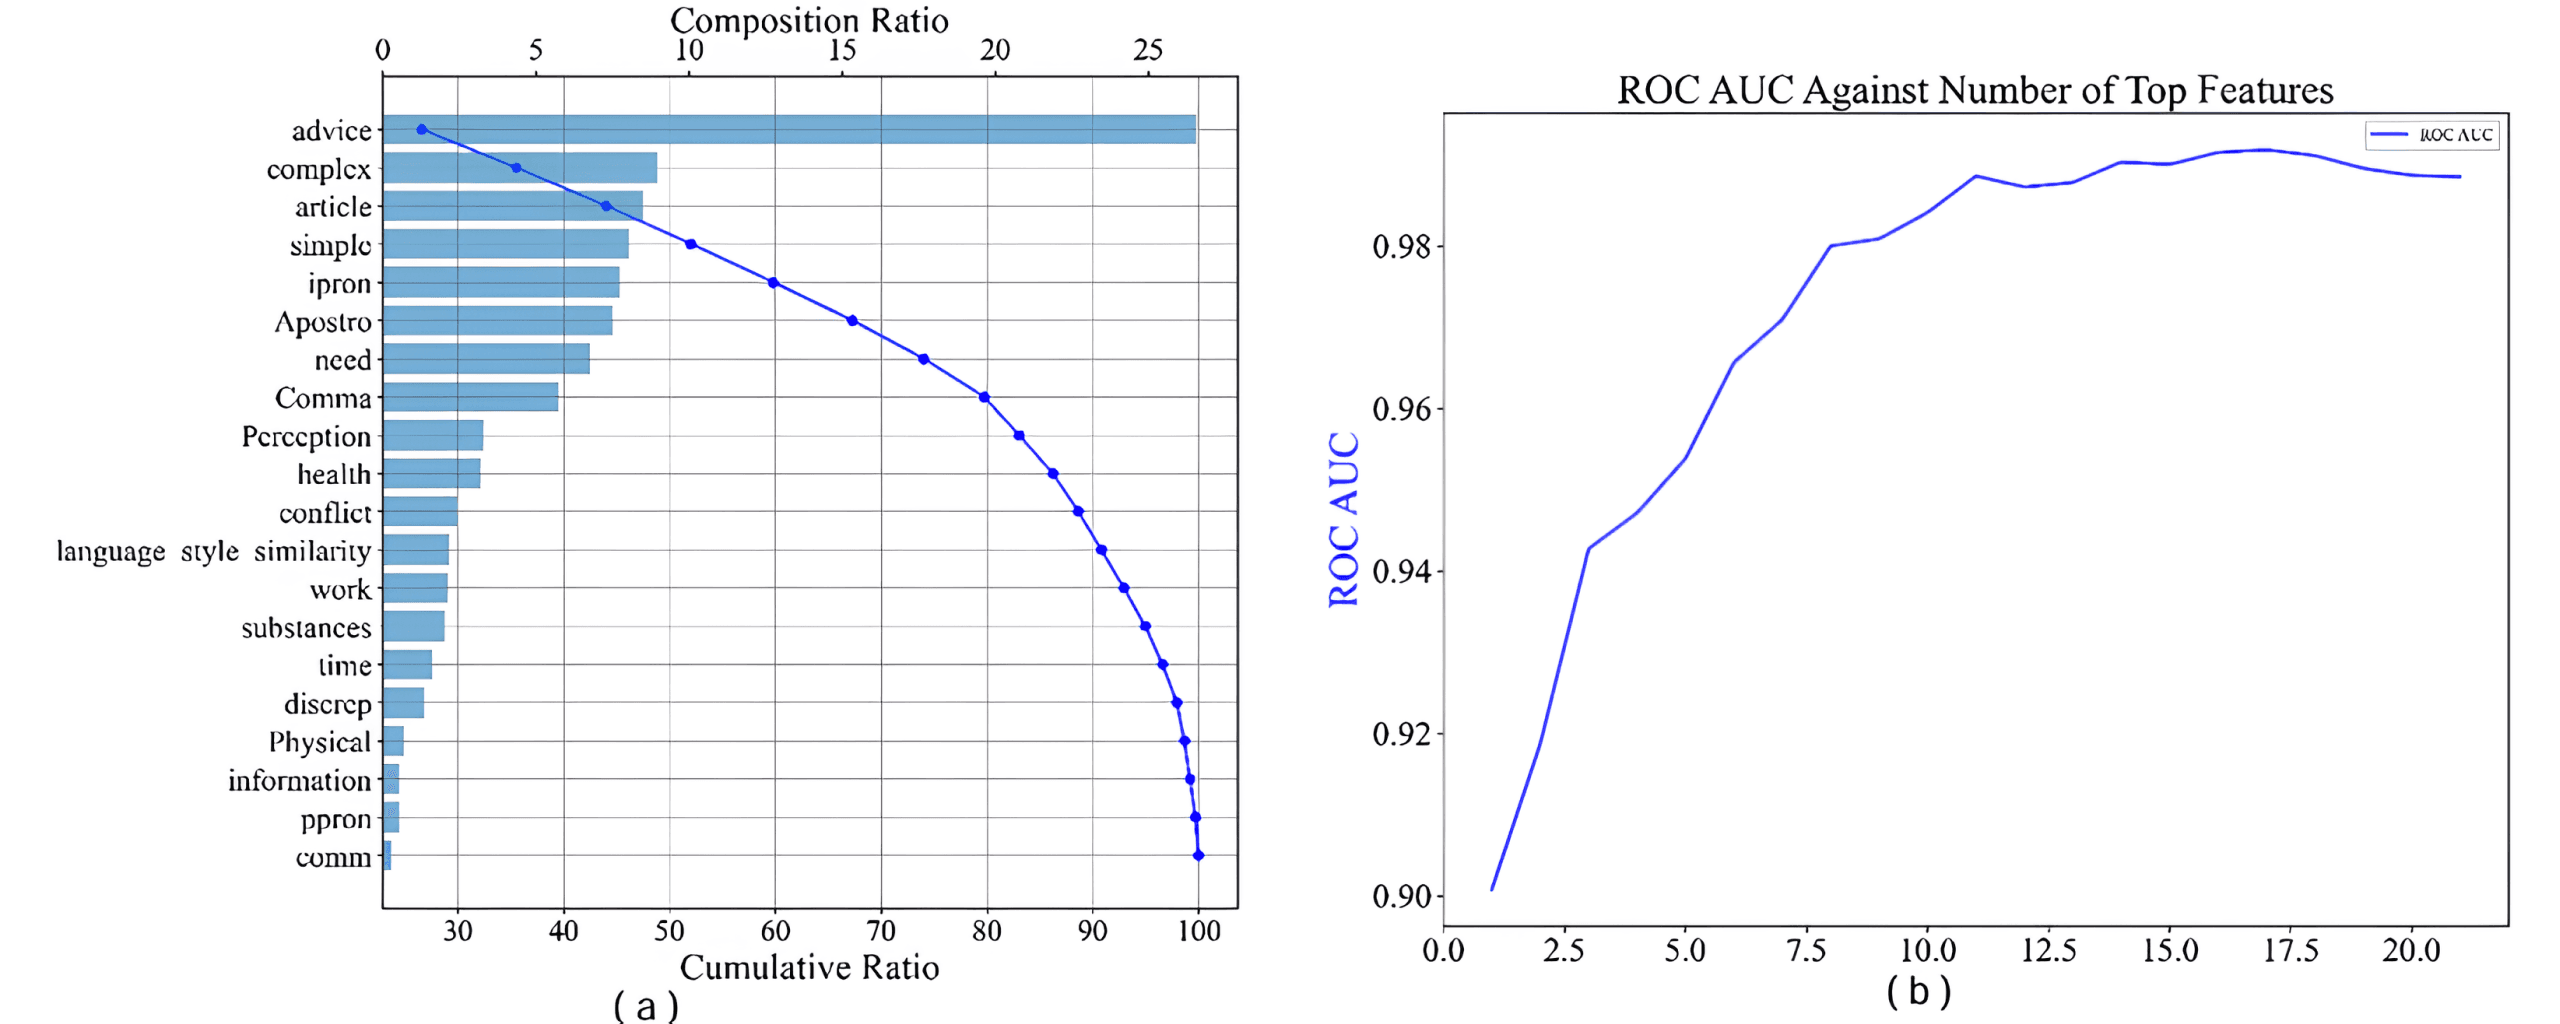
Top predictive features ranked by SHAP value importance and their cumulative impact on model ROC AUC performance for classifying therapist-consistent reflections. Source: AI-Augmented LLMs Achieve Therapist-Level Responses in Motivational Interviewing
High-performing teams don’t treat these measures as a one-time check. They wire in alerts so that if, for example, fraud detection precision drops by 5% in a week, retraining and root-cause checks happen immediately — before losses accumulate. The goal isn’t just a high score once; it’s proving the AI model holds up when reality shifts.
For generative artificial intelligence
Generative AI shifts the measurement challenge: AI model's output that merely sounds plausible isn’t enough. Teams have to check whether content stays factual, non-toxic, and relevant — or they risk scaling hallucinations and hidden bias.
Measuring hallucinations and consistency in natural language processing
For generative AI in natural language processing, hallucination rates and factual consistency are core indicators of reliability.
Core generative metrics include:
Hallucination rate: the percentage of outputs that contain factual inaccuracies.
Factual consistency: comparing summaries or responses to known source material or ground truth.
Toxicity and bias scores: measuring how often the system produces harmful or offensive text.
Response diversity and coherence: especially for chat-based or multi-turn agents.
In practical terms, this means grounding lab benchmarks in real usage. Some content teams run spot-check sweeps on large output batches, score factual accuracy, and track where models slip. Others apply external tests like TruthfulQA or domain-specific consistency benchmarks to monitor hallucination risk under stress.
For personalization workflows, the same logic applies end to end. A 2025 review shows how frameworks like PersonaRAG and RecAgent decompose the pipeline into measurable stages: query rewriting, retrieval relevance (MAP, NDCG), generation quality (BLEU, ROUGE), and task-level success rates. Each stage serves as a checkpoint for whether personalization remains aligned with user context — and where drift or degradation can emerge.
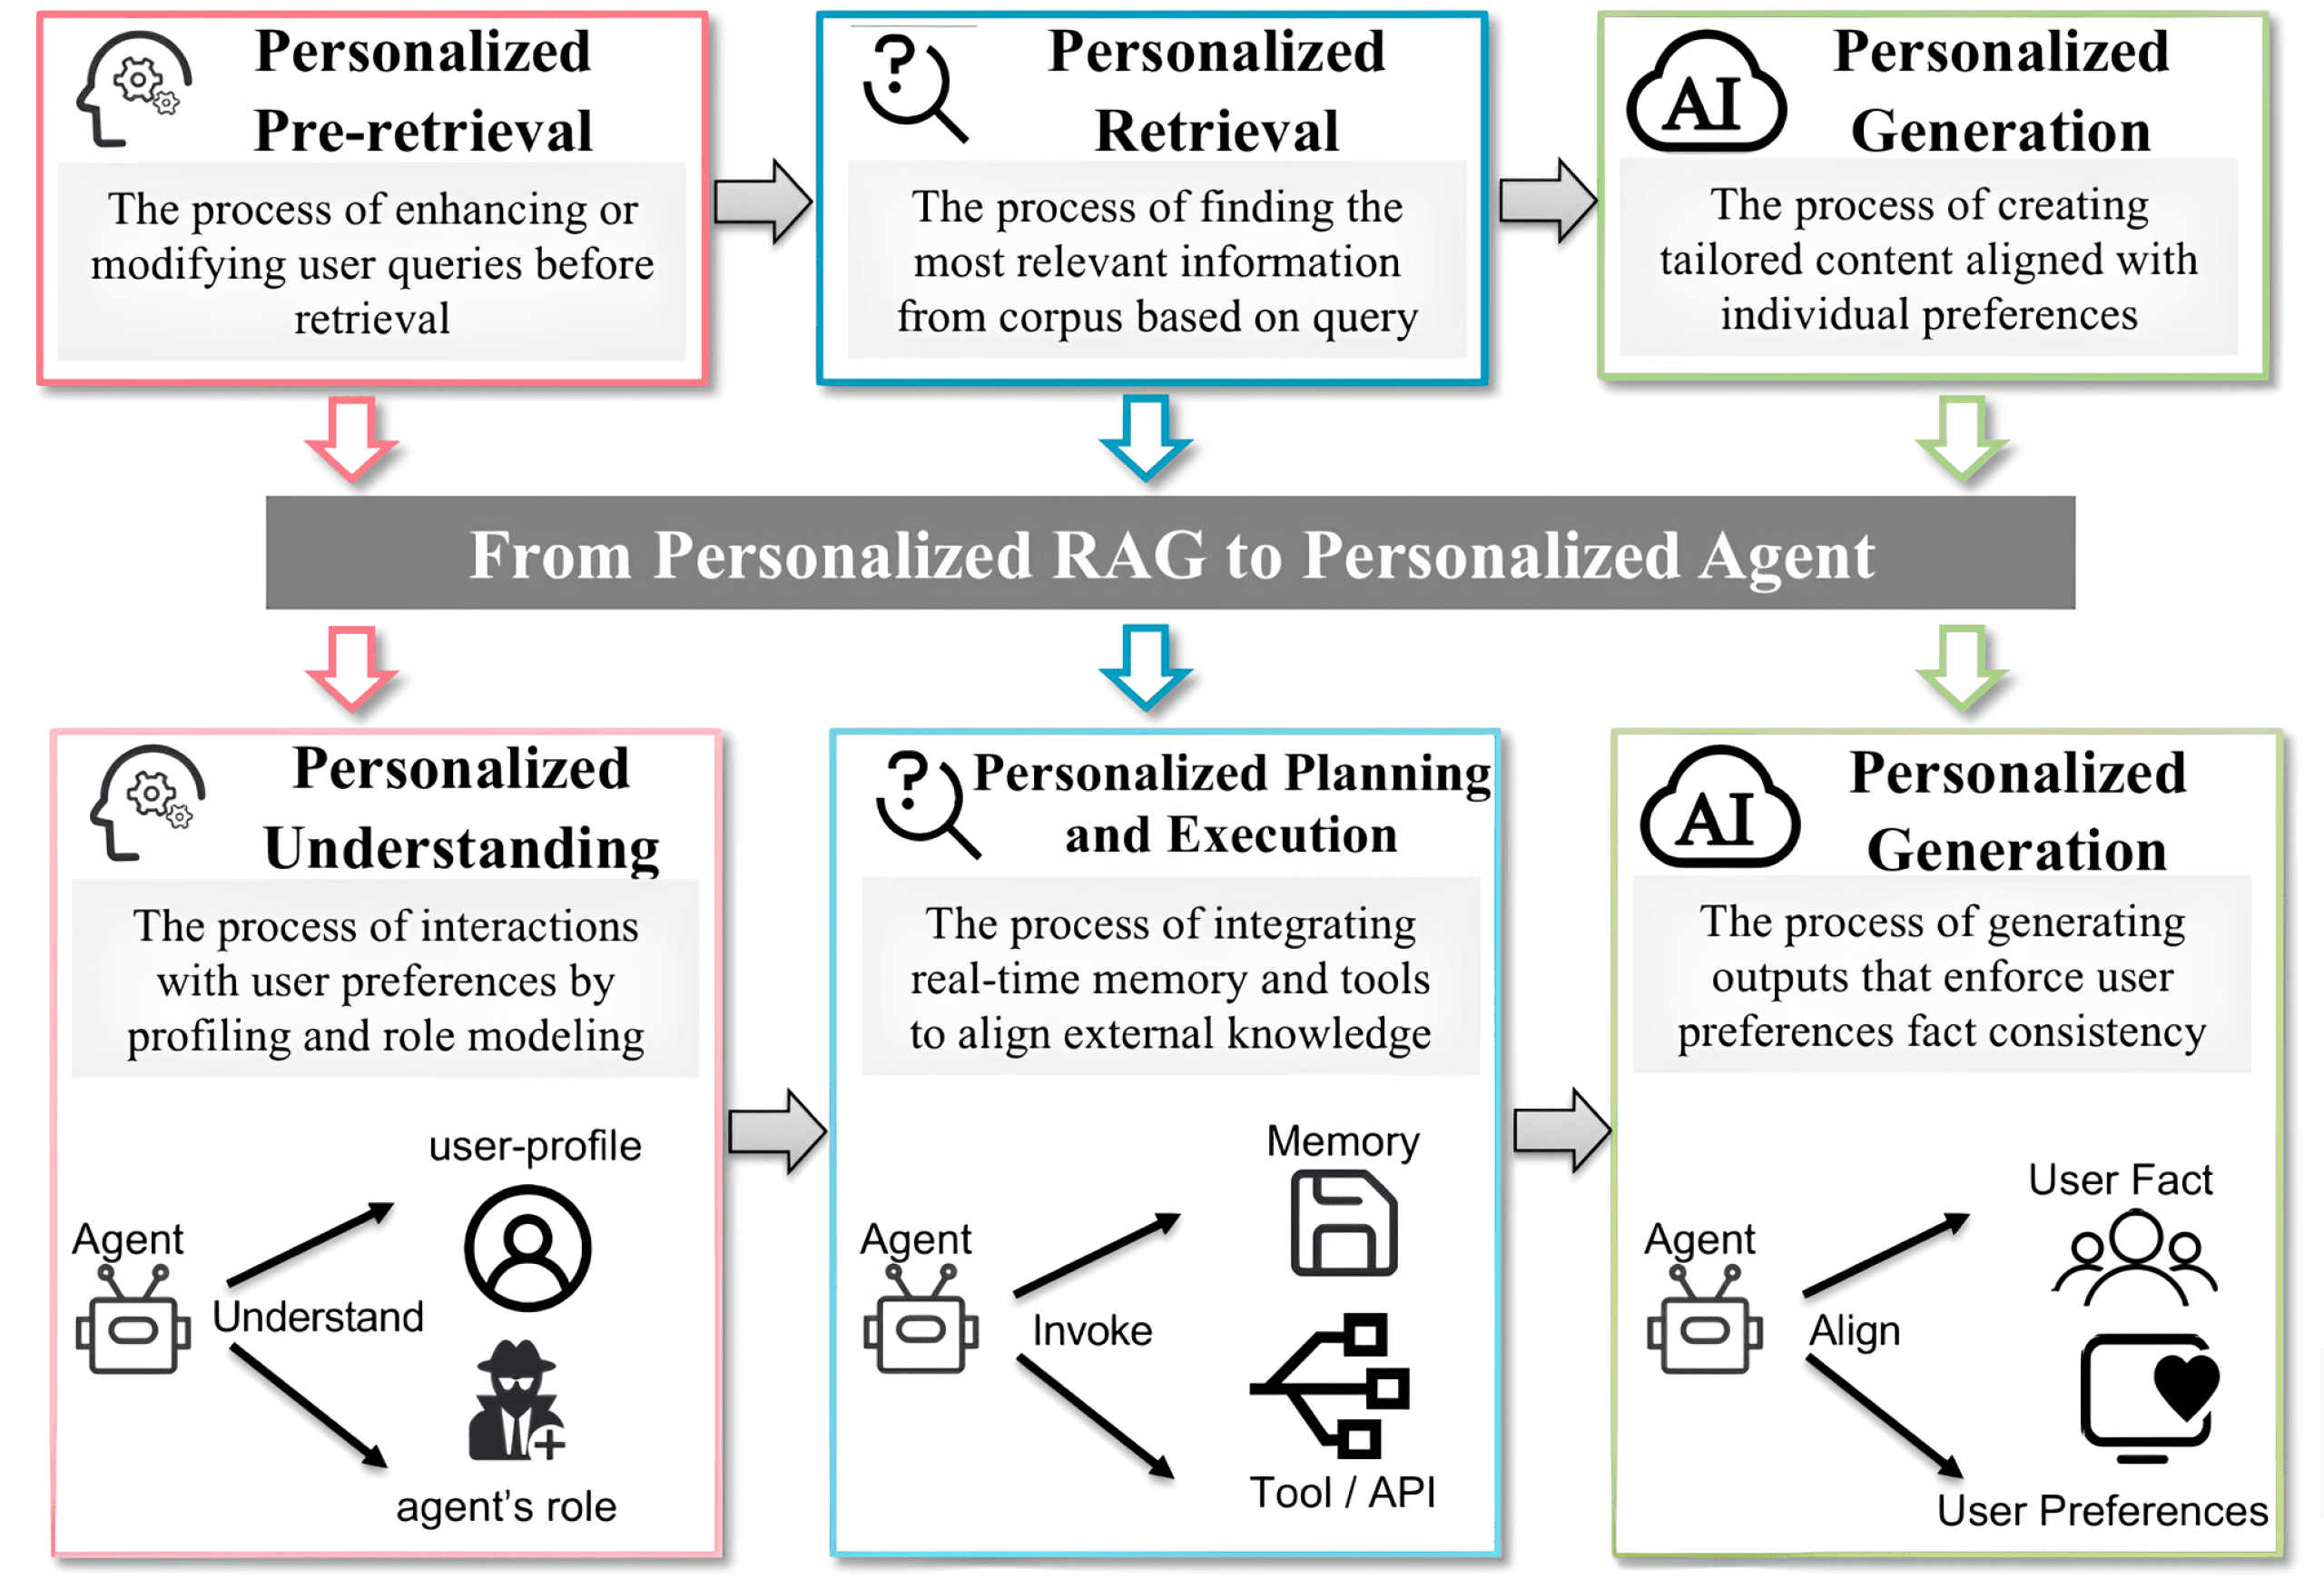
RAG-to-Agent architecture illustrating how personalized query rewriting, retrieval, and generation stages each introduce distinct performance checkpoints. Source: Personalization: From RAG to Agent. Source: A Survey of Personalization: From RAG to Agent
This kind of layered measurement keeps generative systems from drifting into plausible nonsense. High-performing teams tie these scores to real feedback loops so that when hallucination rates spike or relevance dips, retraining or prompt tuning happens before users see failure at scale.
System performance
No matter how accurate an AI model is, its business value evaporates if the system serving it is too slow, unreliable, or expensive to run at scale.
Core system KPIs include:
Inference latency: the time it takes to process a request and deliver a response.
Throughput: how many requests the system can handle per second.
Resource efficiency: how compute and memory demands scale with real-world load.
Cost per 1,000 inferences: a practical baseline for budgeting cloud-hosted workloads.
Carbon footprint per run: an emerging metric as sustainability pressures become part of governance.
What matters is how these numbers align with actual business needs. A streaming recommendation engine can tolerate slightly higher latency than a real-time fraud check or AI co-pilot for code autocompletion. These trade-offs shape budget limits, hardware requirements, and user experience expectations.
Modern operational metrics go beyond lab scenarios. A 2025 ConsumerBench study shows how system-level SLOs (service-level objectives) hold up for GenAI tasks like chatbots, image generation, and live captions on real user devices. Measuring whether AI models hit latency targets under realistic conditions is a baseline for reliability — not an optional add-on.
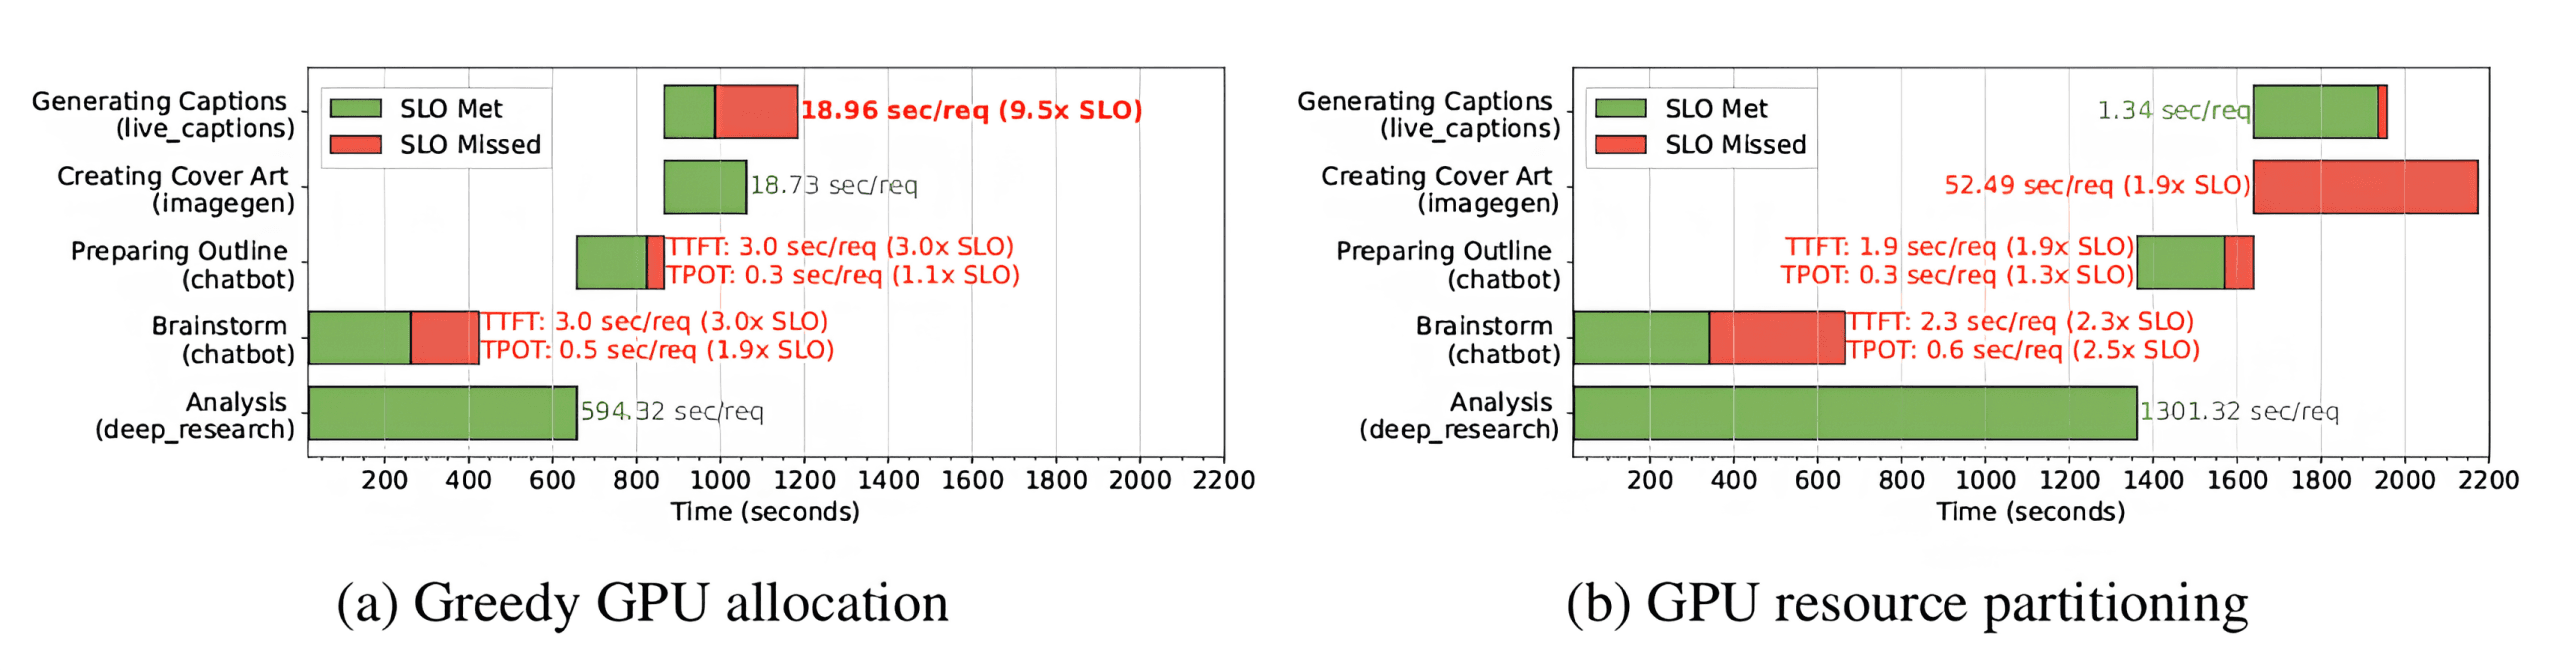
End-to-end latency and SLO attainment for content-creation workflows with and without GPU partitioning on end-user devices. Source: ConsumerBench: Benchmarking Generative AI Applications on End-User Devices
Well-designed teams treat these system KPIs as non-negotiable. Performance dashboards surface spikes in latency or resource bottlenecks early, so fixes happen before slowdowns reach the customer or budget overruns spiral out of control.
The ethical dimension
Responsible Artificial Intelligence is the pillar that keeps high-performing systems sustainable. This isn’t just regulatory box-checking — it’s about proving your models don’t expose you to reputational, legal, or societal risk. Mature teams turn broad principles and actual values into measurable signals so that fairness, explainability, and accountability live in the same dashboards as revenue and latency.
Fairness and bias
Bias can hide in plain sight if no one measures it. Good practice starts with demographic parity: do different groups receive favorable outcomes at similar rates? Equal opportunity checks whether true positives hold across segments. Predictive parity tests whether the model’s confidence is equally reliable for all users.
A hiring or lending AI model that screens out entire applicant pools based on hidden bias can sink a brand overnight. Frameworks like SAFE-AI, proposed in 2025, show how smaller healthcare AI developers can build fairness metrics — such as gender or age subgroup checks — directly into Agile sprints, catching drift or imbalance early so they align with nondiscrimination rules.
SAFE-AI’s continuous ethical evaluation loop: fairness checks, subgroup tests, and tolerance thresholds integrated throughout model development and deployment. Source: A Practical SAFE-AI Framework for Small and Medium-Sized Enterprises Developing Medical Artificial Intelligence Ethics Policies
Transparency and explainability
Explainability is becoming enforceable across sectors. Financial services, healthcare, and recruitment systems must show how AI decisions are made and how people can contest them.
Living artifacts like model cards provide clear records of training data, known limitations, and failure modes. Algorithmic Impact Assessments (AIAs) help organizations weigh risks and report them clearly. Counterfactual explanations — showing people how they could get a different outcome — build trust and reduce disputes.
Policy frameworks like The California Report on Frontier AI Policy (2025) — not yet binding law, but a roadmap for future regulation — outline principles for third-party evaluations and stronger disclosure, making explainability an operational requirement, not just an aspiration.
Accountability
Accountability is where governance meets reality. It’s not enough to publish a fairness score once and move on — AI project teams need audit trails, human override mechanisms, and clear escalation paths.
Recent research shows how disclosure can unintentionally distort outcomes when algorithmic judgments interact with sensitive traits like race or gender. This “vanishing alignment” effect means fairness corrections can disappear under real-world conditions — highlighting why oversight can’t be a one-time check. Logging overrides, tracking where an AI model fails, and feeding that back into retraining keep fairness and accuracy from drifting silently over time.
Putting it all together: a holistic AI measurement strategy
When done well, AI measurement isn’t just a collection of isolated dashboards. Integrated monitoring systems provide valuable insights that align technical performance with business goals and responsible AI practices.
A practical setup layers measurement at three levels. Daily or weekly: automated checks for drift, model performance dips, or fairness deviations. Monthly: business reviews that tie technical signals to revenue, cost, or customer impact. Quarterly: governance sessions that examine compliance, audit trails, and Responsible AI thresholds.
For example, an e-commerce team might run daily precision checks on a recommendation model, link weekly A/B test lifts directly to incremental sales, and review quarterly fairness audits with legal and risk.
This loop keeps everyone aligned — data scientists, PMs, and executives — and ensures you’re never guessing whether your investment is paying off. When dashboards are visible and alerts are actionable, teams catch trouble early and iterate with confidence.
Final thoughts: avoiding common pitfalls
The promise of AI applications is real, but so are the risks of measuring model performance poorly. Too many AI projects still treat model accuracy as the finish line, overlooking system bottlenecks, hidden costs, or drift that creeps in over time. Dashboards exist, but they’re isolated; signals are buried instead of driving decisions.
A few pitfalls show up again and again:
One-time metrics: Logging a fairness score once, then ignoring drift until a headline hits.
Lab-only benchmarks: Hitting high precision in sandbox tests, but failing to measure latency or cost in production.
Disconnected KPIs: Tracking technical key performance metrics without tying them back to revenue, operational efficiency, or compliance thresholds.
The best teams break out of these traps by treating AI model performance evaluation as a full-loop discipline. They embed checks into daily workflows, link model and system signals to business KPIs, and put Responsible AI metrics in the same dashboards as profitability and uptime.
Done well, this approach gives everyone — from engineers to business leaders — a shared view of measuring AI success.
Subscribe to Toloka news
Case studies, product news, and other articles straight to your inbox.